Operational emissions views
Build configurable CO₂e views by trip, route, fleet, site, process or unit of output using governed activity data and selected emission factors.
Use fuel, distance, idle time, power, water, throughput and process activity to build useful environmental intensity views and improvement controls.
Carbon, energy, water, waste and evidence become more actionable when management can see trends, intensity and operational causes together.
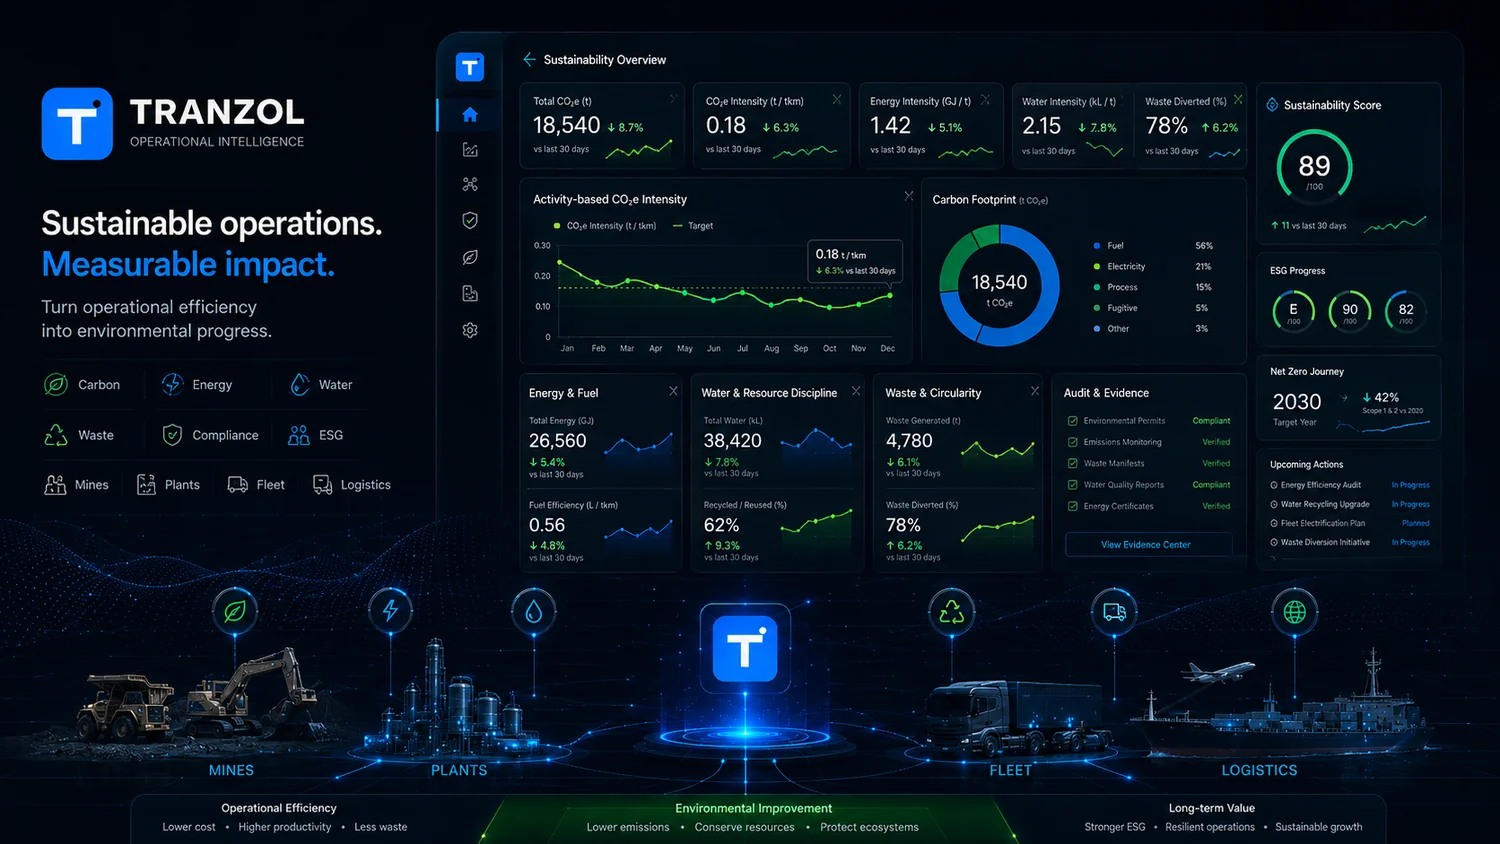
Activity-based carbon intensity, energy, water, circularity, ESG progress and supporting evidence in one visual framework.
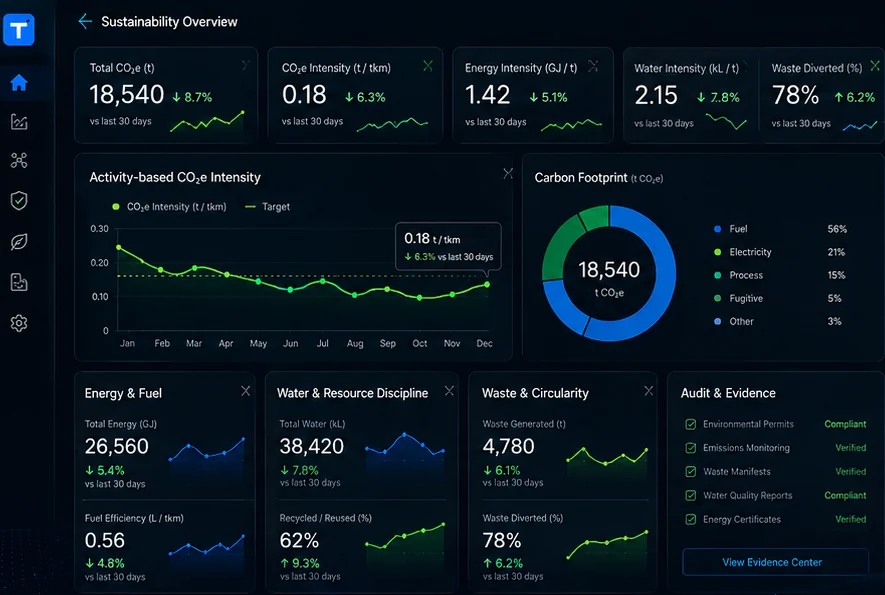
Carbon and resource metrics become more actionable when they are linked to the trip, route, asset, site, process or production event that created them.
Build configurable CO₂e views by trip, route, fleet, site, process or unit of output using governed activity data and selected emission factors.
Track power, fuel and resource intensity against throughput, operating conditions and baseline.
Monitor usage, rework, process waste and abnormal resource consumption where relevant data is available.
Queue reduction, route optimization, lower rework and higher reliability can improve both cost and environmental performance.
Link source events, calculations, documents and approvals to improve auditability of sustainability reporting.
Put CO₂e, water and energy intensity beside throughput, reliability, safety and cost instead of separating them from operations.