Variation
Different shifts, routes, operators, process conditions or material quality can create unstable cost and output.
AI detects hidden patternsA practical continuous-improvement model for reducing variation, predicting losses, removing waste and turning insights into measurable operating standards.
Use a visual improvement cockpit to connect DMAIC stages, KPI trees, process variation, impact and the control plan.
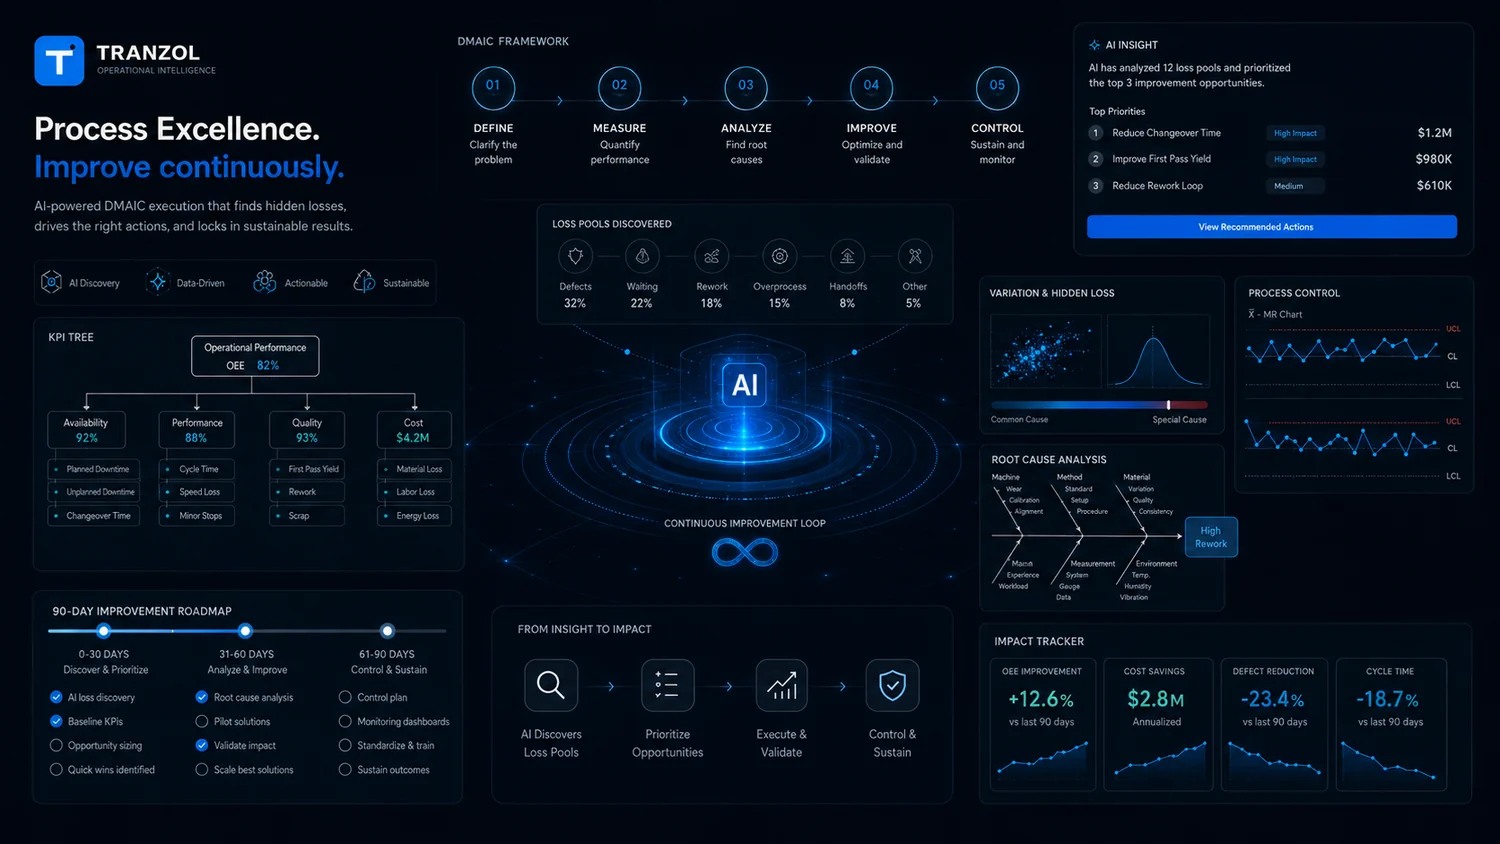
Discover losses, prioritize improvement, validate impact and lock successful changes into control.
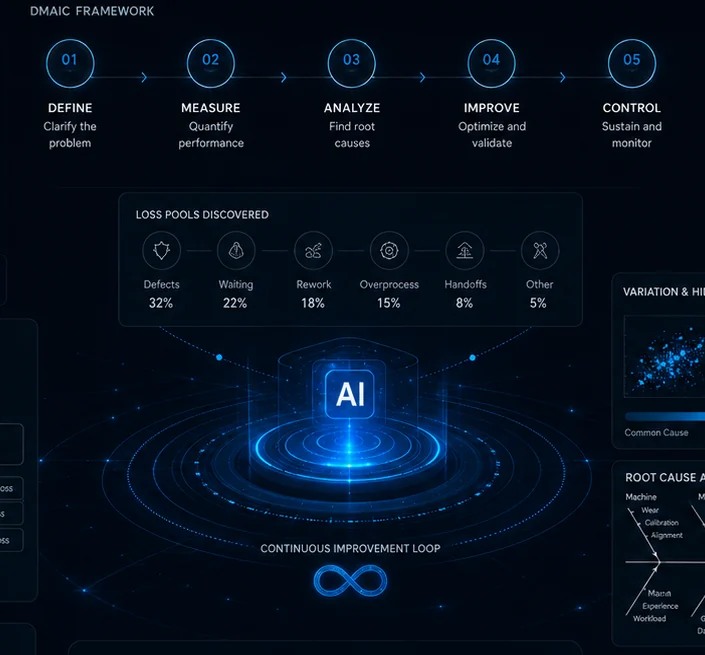
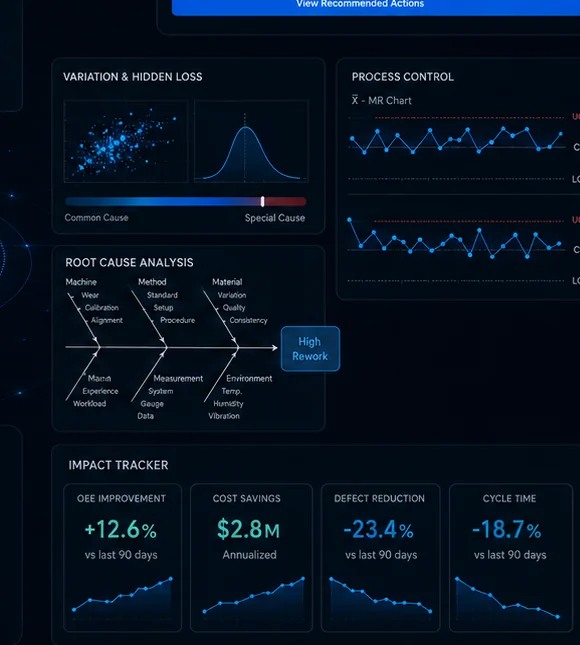
Tranzol combines operational data and structured improvement methods to find weak signals earlier and make corrective action measurable.
Different shifts, routes, operators, process conditions or material quality can create unstable cost and output.
AI detects hidden patternsIdle time, queueing, rework, micro-stoppages and operating waste can remain buried in logs and spreadsheets.
AI surfaces loss poolsProblems often move slowly from field observation to management action because context is fragmented.
AI prioritizes exceptionsEnergy, water, diesel and consumables need the same operating discipline as throughput and cost.
AI flags abnormal consumptionAI accelerates measurement, analysis, prioritization and control while DMAIC keeps ownership, targets and standards explicit.
Start with high-loss processes rather than a long transformation workshop.
Select pilot, owner, target metric and daily loss account.
Map sources, clean priority variables and set exception visibility.
Analyze root causes, test countermeasures and publish verified wins.
SOPs, dashboards, audit checklist, training and next-wave backlog.